How to Use Data to Improve Your On-Demand Taxi Business like the Way Uber Does to Shine in the Market
Uber is the only on-demand startup which has a presence in almost every city in the world. They started with one car in San Francisco and in just a few years, they reached global recognition.
Entrepreneurs and businessman, who want to enter the on-demand taxi industry have got a lot to learn from Uber. Uber collects an enormous amount of data for visualization, and this is the reason for their efficient and effective handling of their business.
Uber is basically a ride handling company. People use Uber for convenience although it is 2x costlier than traditional taxi firms.
The working of Uber is very simple that with just a tap on the smartphone, one can book a ride. Despite this, there are some teething problems for Uber like poor city transportation infrastructure, traffic jams, uncooperative drivers and much more.
Still, Uber has changed the way we move and is poised to change even more as the service comes to more and more cities. But what’s actually happening in the background and what can we learn from it?
Behind the scenes
Uber has an enormous amount of data about drivers. So as soon as you request a ride, Uber’s algorithm goes right to work in less than 15 seconds and it matches you with the driver closest to you. In the background, Uber is storing data for every trip taken.
All of this data is stored and leveraged to predict supply and demand, as well as setting fares. Uber also uses these data for heat view, in that it directs the drivers to the area where the concentration of people is high.
Uber also gathers data on its drivers. In addition to collecting non-identifiable information about their vehicle and their location such as vehicle speed and acceleration.
All of this data is collected, cleaned, analyzed and used to predict everything from the customer’s wait time to setting fares for each ride. All of these items are implemented in real-time for both drivers and passengers alike.
Supply and Demand monitoring
The biggest use of data for Uber comes from surge pricing. Surge pricing is the concept of increasing fares in line with increased demand. Sometimes the fares may go up 2x or 3x depending on the demand.
In 2011, during the new year eve, the Uber fare went from $38 to $140 for a ride. Using surge pricing all the time is not good and can cause the customers using other alternatives. Uber know this and they use data analytics to determine when and where to use surge pricing.
This is how Uber used data for determining supply and demand. The supply and demand data is not the same for all cities, so Uber engineers devised a way to map the “pulse” of a city to connect drivers and riders more efficiently. Just look at how New York City compares to London: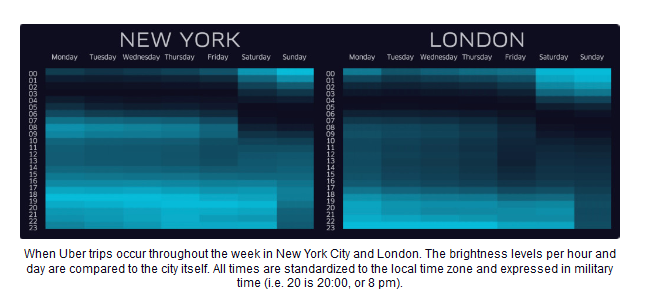 Source: www.neilpatel.com
Above map corresponds that demand level is not the same for two big cities.
Get Free Demo of Taxi Booking App Development – WhatsApp | Skype
Visualizing data analytics
Collecting data from different resources is not a big deal until it is used for some purposes. For this only Uber employs many data scientists across their offices. Not to mention, they have made the best use of their data like I mentioned above in supply and demand.
For example, Uber manages billions of GPS locations. Every minute, their platform manages and works between millions of events. They use data visualization to leverage these details into a way to better manage moving people from place to place.
Data visualization specialists at Uber range from computer graphics professionals to information design. They handle everything from mapping and framework developments to data extrapolations that the public sees. And a lot of these data extrapolations and visualizations have never been done before and Uber has reaped maximum benefits from this.
Below are some of the data visualization techniques used by Uber:
Mapping Applications for City Ops Teams and General Managers
In big cities, understanding of the density of the city population is important in determining the fares and surge pricing. Uber demonstrates this with a combination of layers that let them drill-down to see specific areas in more detail:
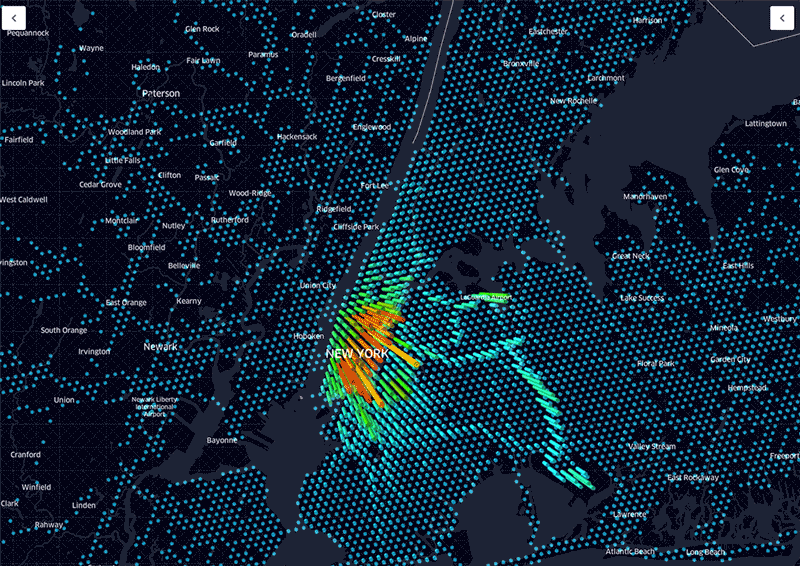
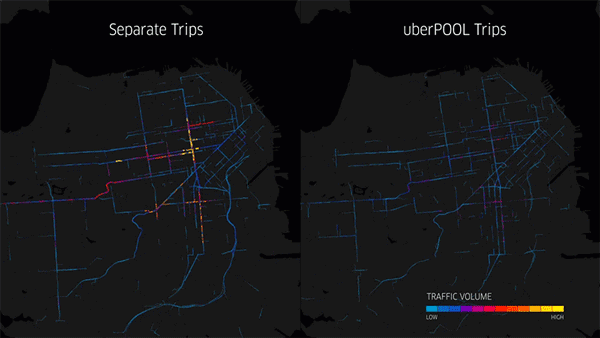
Below is the data visualization of New York city which showcases the people density which is used for UberPOOL services.
Take away for newbies who entered taxi industry
Uber is not taking data just for the sake of taking it. They turn that data into something more useful. Whenever you are taking data and not using it, you are missing a big opportunity to grow and improve the business.
If you don’t have the kind of tools used by Uber for data visualization, make a new one. Even if the tool is a basic one, it’s not a problem.
Uber owes its success to the work it does at the background. So, if you want to follow the path of Uber, emulate the function of Uber and if possible, use your creativity and try to innovate something which Uber failed to do.
SpotnRides is a leading firm in developing software solutions mainly related to taxi industry. We have helped many people in their on-demand taxi business by offering our Uber like taxi booking app. SpotnRides also offer ddata-driven basic analytics for the improvement of your business.
If you are looking for a quick response team to clarify your doubts instantly about your new business venture, please connect with our expert team at Whatsapp or write a quick email to hello@spotnrides.com.
Get Free Demo of Taxi Booking App Development – WhatsApp | Skype
About the author
Comments are closed.